

Images pop in one after another and push the text down just as you're about to tap. You click a button and, for a moment, nothing happens. On your phone, it takes a noticeable while before anything shows up at all. Pages like this are everywhere, and sooner or later Google Search Console flags what visitors have felt for a long time: a Core Web Vitals issue. Sound familiar?
To be honest, Core Web Vitals don't carry much weight as a ranking factor. Good, relevant content matters far more, and nobody jumps to position one on green scores alone. But rankings are the wrong reason to care anyway. The real reason is more direct: a page that loads slowly, jumps around and lags on every click loses people before they ever reach the content.
The good news: that's fixable. Once you understand what drives each of the three numbers, a vague "something feels slow" turns into a clear to-do list. That's what this guide is about. I'll go through each metric one by one, show you what pushes it into the red, and explain how to fix it.
What are Core Web Vitals?
Core Web Vitals (CWV) are a set of three metrics Google uses to measure the real-world user experience of a web page. It's not about raw load time on paper, but about how a page feels to actual visitors: how quickly the content appears, how fast the page reacts to clicks, and how stable the layout stays while it loads.
The three metrics are:
- Largest Contentful Paint (LCP): measures load speed
- Interaction to Next Paint (INP): measures responsiveness
- Cumulative Layout Shift (CLS): measures visual stability
Core Web Vitals have been a confirmed Google ranking factor since 2021, as part of what Google calls page experience. That doesn't mean they trump everything else. Good content is still the biggest lever. But when two pages are equally strong on content, Core Web Vitals often tip the scales.
Think of them as a bouncer: they won't make good content any better, but poor scores can keep good content from reaching its full potential.
Field data vs. lab data: the part most people miss
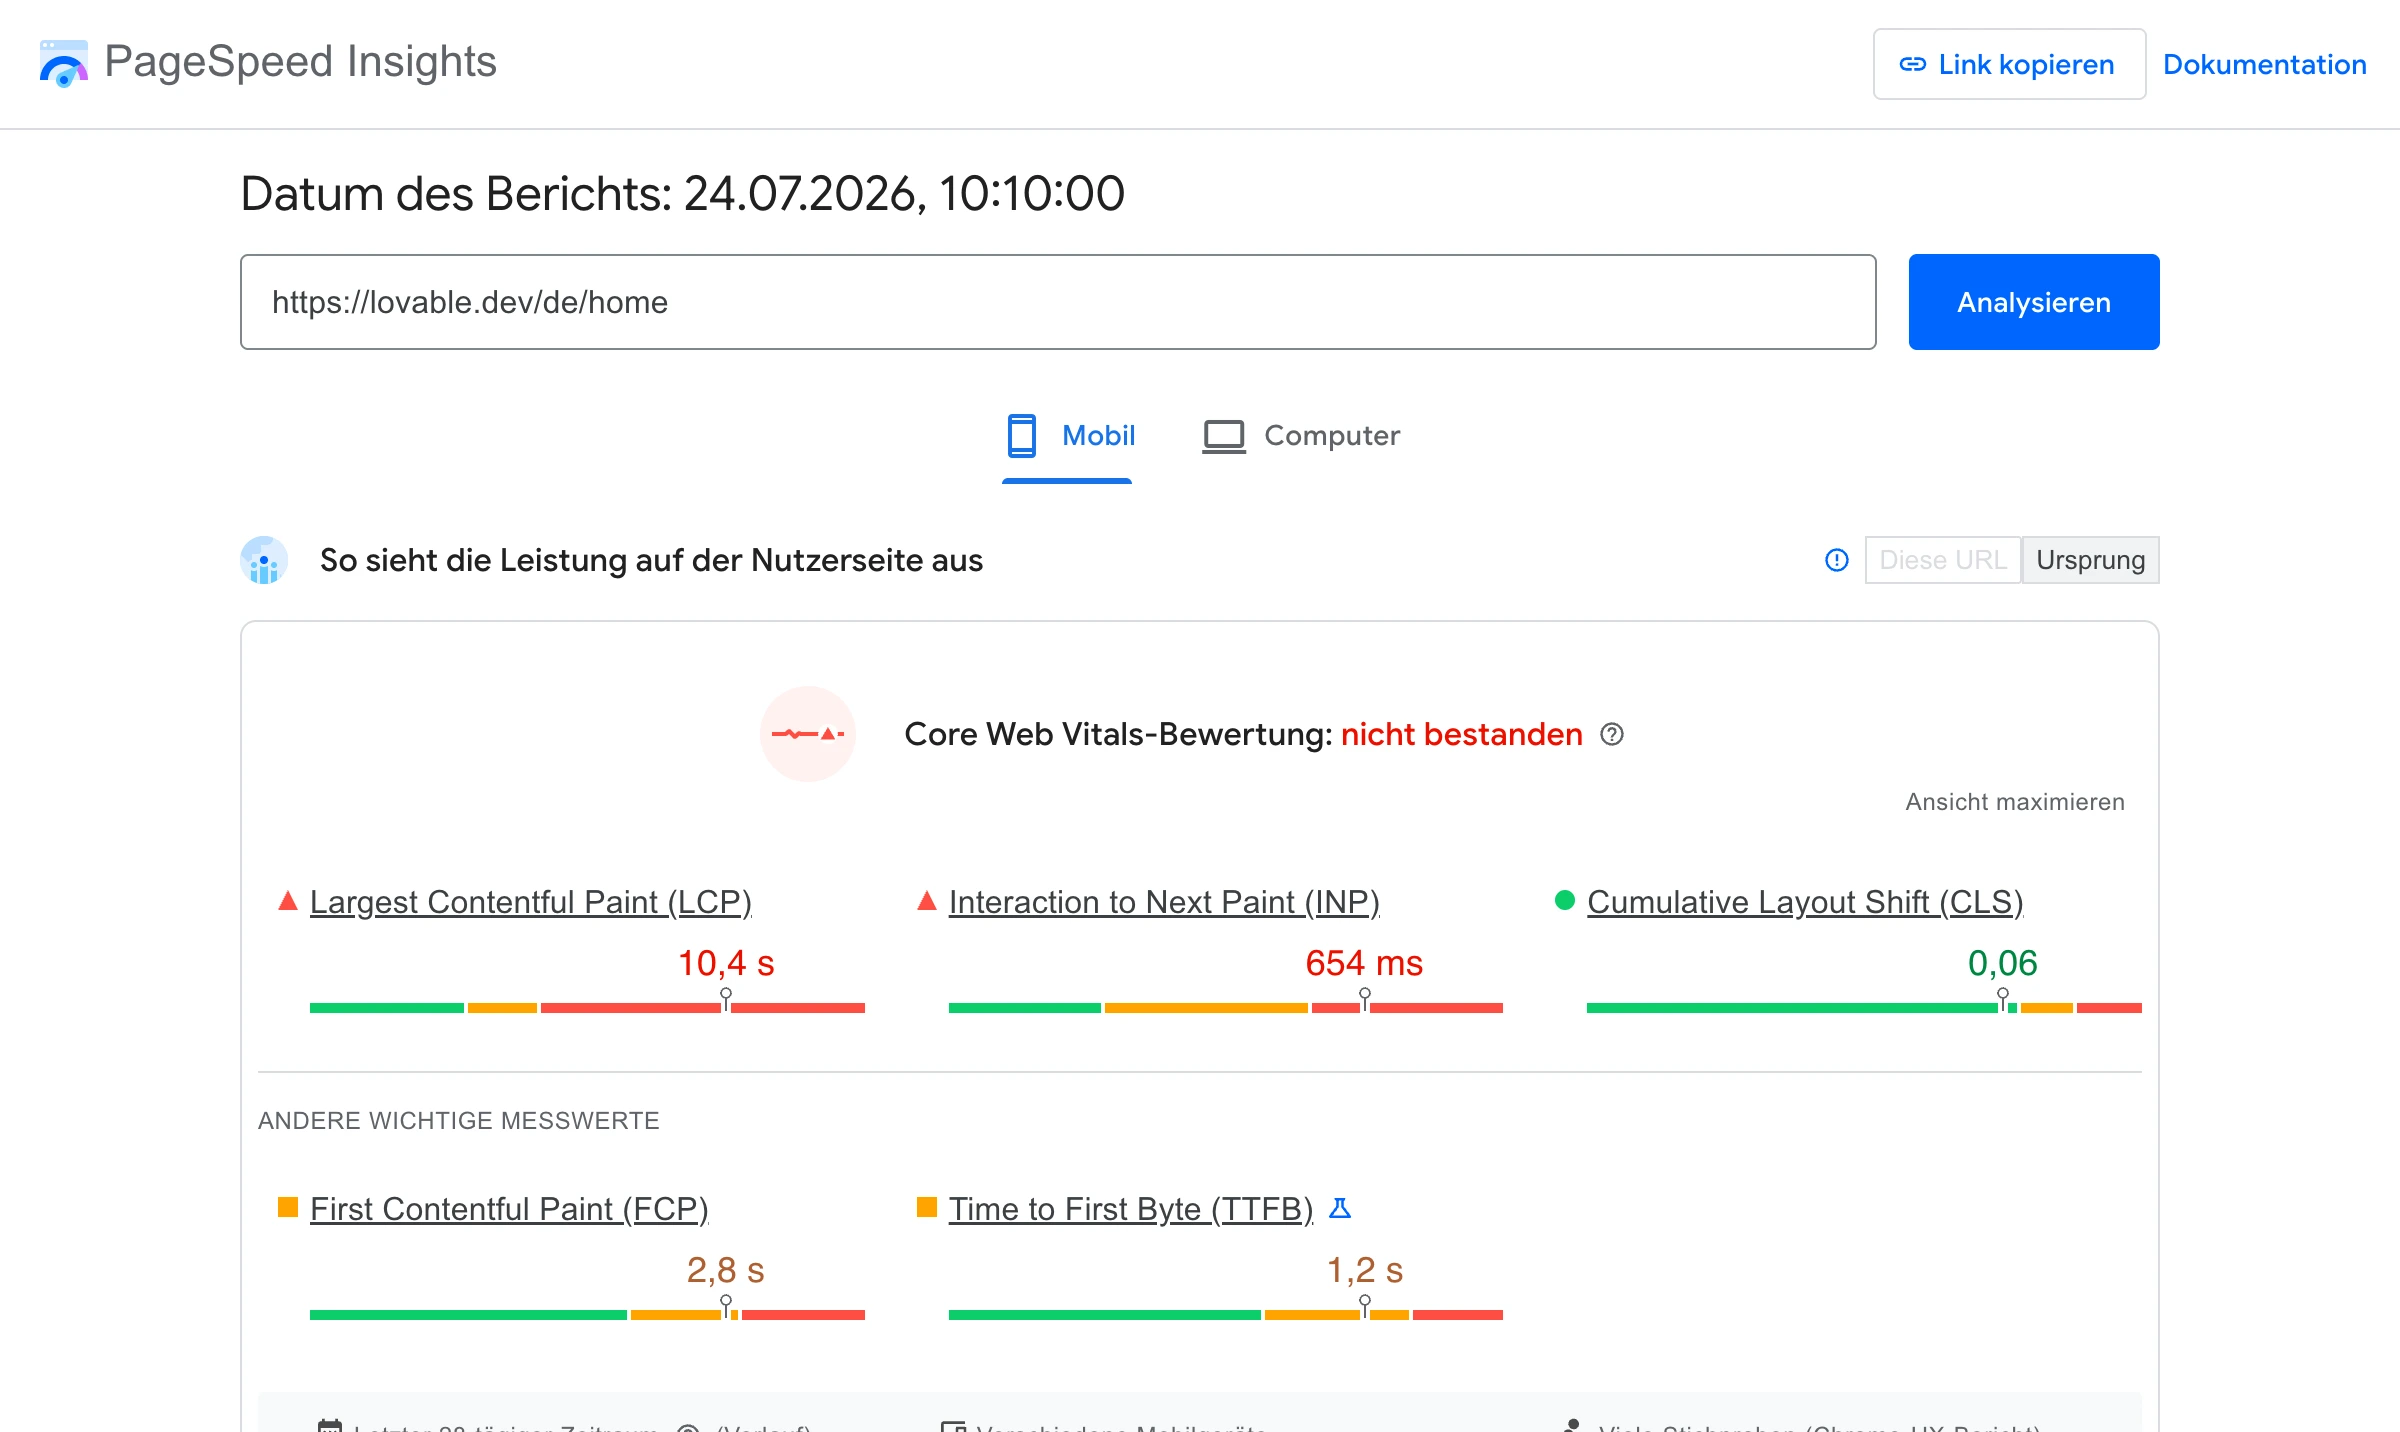
One detail that's easy to overlook: Google assesses Core Web Vitals using field data, not lab data.
- Lab data comes from a simulated test environment, for example when you run a page through a tool like Lighthouse. Useful for debugging, but it's a one-off snapshot under controlled conditions.
- Field data comes from real users on real devices and real connections. Google collects it anonymously from Chrome users.
Rankings are based on field data, collected over a rolling 28-day window. That has a practical consequence: if you ship a fix today, you won't see the result this afternoon. It takes time for enough real visits to come in. If you panic after a single PageSpeed test and start ripping out plugins, you may well be optimizing for a lab result your users never actually experienced.
What does the 75th percentile mean?
Another term you'll keep running into: Google evaluates each metric at the 75th percentile. It sounds more complicated than it is. It simply means that at least 75 percent of your visits need to fall in the "good" range for the page to pass. Not the average, and not your best result on a fast office computer. What counts is the experience of most of your visitors, including the person on a three-year-old Android phone on the train.
Why 75 percent? In its documentation on the thresholds, Google describes it as a deliberate trade-off between two goals: the vast majority of visits should hit the target, but a handful of outliers shouldn't be able to swing the result.
A higher percentile, like the 95th, would be much more sensitive to outliers. Out of 100 visits, just five bad ones (say, on a patchy mobile connection) would be enough to skew the value. At the 75th percentile, 25 out of 100 visits would have to fall outside the range before the result shifts. That's far more robust, and it still tells you something useful: at least three out of four visitors get the measured performance or better.
And all three metrics have to pass at the same time. Two green scores don't help much if the third one is red. That's also the most common reason pages fail: one weak metric drags down two strong ones.
The current thresholds at a glance
Before we get into the details, here are the numbers. These are the official thresholds from Google's current Search Central and web.dev documentation:
| Metric | Good | Needs improvement | Poor |
|---|---|---|---|
| LCP | under 2.5 s | 2.5 to 4.0 s | over 4.0 s |
| INP | under 200 ms | 200 to 500 ms | over 500 ms |
| CLS | under 0.1 | 0.1 to 0.25 | over 0.25 |
Largest Contentful Paint (LCP): Why does my page feel so slow to load?
Largest Contentful Paint (LCP) measures how long it takes for the largest visible element in the viewport to load. That's usually a hero image, a video thumbnail or a large block of text. In other words, LCP marks the moment the user thinks: okay, the page is here.
The target is under 2.5 seconds.
What affects LCP?
LCP problems almost always come down to resources and server time. The usual suspects:
- Slow server response (high TTFB). If your server takes seconds just to send the first byte, it doesn't matter how well optimized everything else is.
- Large, uncompressed images. A 3 MB hero image is a classic. The browser has to download all of it before it can render it.
- Render-blocking resources. CSS and JavaScript files the browser has to fully process before it can display anything.
- The key resource isn't preloaded. The browser discovers the hero image late because it's buried deep in the HTML or set as a CSS background.
- Client-side rendering. On JavaScript-heavy setups, all the code has to run before any content shows up.
What this looks like in practice
Take a typical online store with a large product image at the top. The image is an uncompressed 2.8 MB JPEG, and the browser only finds it after parsing half the HTML. The result: an LCP of 5.2 seconds. Deep in the red.
How to fix a poor LCP
- Speed up your server. Better hosting, smart caching and a CDN (Content Delivery Network: a network of distributed servers that delivers content from a location closer to the user). Ideally, TTFB should be under 200 milliseconds.
- Preload your most important resource. Explicitly prioritize the hero image so the browser fetches it right away:
<link rel="preload" href="/hero.webp" as="image" type="image/webp" fetchpriority="high">
- Use modern image formats. WebP or AVIF instead of JPEG or PNG. That often cuts file size by 30 to 70 percent with no visible loss in quality. Also size your images correctly and serve them responsively (
srcset). - Eliminate render-blocking resources. Inline critical CSS in the head and load the rest asynchronously. Load non-critical JavaScript with
deferorasync. - Use resource hints. Connect to important third-party domains early so the browser doesn't start the handshake too late:
<link rel="preconnect" href="https://cdn.example.com">
<link rel="dns-prefetch" href="https://cdn.example.com">
- Get the server basics right. Enable Brotli or Gzip compression and use modern protocols like HTTP/2 or HTTP/3. That noticeably cuts transfer times, often without touching a single line of front-end code.
- Consider server-side rendering if a JavaScript-heavy page would otherwise render its content late.
Work through these points and 5.2 seconds can quickly drop to 1.8. And the difference isn't just a green number: everyone who opens the page will notice it.
What is LCP actually made of?
If you want to fix LCP in a targeted way, it helps to know that it breaks down into four consecutive phases. Each one is a separate lever:
- Time to First Byte (TTFB): the time until the server sends the first byte. Lever: hosting, caching, CDN.
- Resource Load Delay: the delay before the browser starts loading the LCP resource. Lever: preload and
fetchpriority, so the image gets discovered early. - Resource Load Duration: how long the resource itself takes to download. Lever: smaller files, modern formats, a CDN.
- Element Render Delay: the time between the resource finishing loading and actually appearing on screen. Lever: remove render blockers so the browser isn't left waiting.
The trick: measure which of the four phases takes the longest on your site and start there. Otherwise you're optimizing the wrong thing.
Interaction to Next Paint (INP): Why is my page so slow to respond?
Interaction to Next Paint (INP) measures how quickly a page responds to user interactions: clicks, taps and key presses. More precisely, it's the time between the user's action and the moment the browser can paint the next visual update. INP looks at every interaction during the visit and reports the slowest one (or, on pages with lots of interactions, one close to the slowest).
The target is under 200 milliseconds.
Quick recap: INP replaced FID
Until March 2024, responsiveness was measured by First Input Delay (FID). FID only measured the delay of the very first interaction. The problem: that first click tells you very little about how the page feels over the whole visit. INP measures every interaction instead, which makes it more honest, but also much harder to pass.
According to various analyses, INP is now the Core Web Vitals metric that sites fail most often.
What affects INP?
INP is the metric where your JavaScript architecture really matters. Compression and HTML attributes won't help here. It's all about how your code handles interactions:
- Heavy JavaScript on the main thread. Any JavaScript task that runs longer than 50 milliseconds blocks the main thread. While it runs, the browser can't respond to clicks.
- Expensive event handlers. Complex calculations that fire on every click or scroll.
- Third-party scripts. Chat widgets, analytics, tag managers, ad scripts. Whatever third-party code does on the main thread counts against your INP.
- An oversized DOM. The more elements a page has, the longer every recalculation takes.
- Unnecessary re-renders, especially in React, Vue and similar frameworks, when components re-render more often than they need to.
What this looks like in practice
Clicking the add-to-cart button triggers a heavy JavaScript function that runs as one long task. It blocks the main thread for 600 milliseconds straight, and the user stares at a button that does nothing for what feels like forever. INP: deep in the red.
How to fix a poor INP
- Break up long tasks. Split big tasks into smaller chunks and give the browser a chance to respond in between. In modern browsers you can do this with
scheduler.yield(), withsetTimeoutorrequestIdleCallbackas a fallback. - Use code splitting. Split your JavaScript into chunks that only load when they're needed, instead of shipping everything up front.
- Load non-critical scripts with
deferorasyncso they don't block rendering. - Trim the DOM and avoid unnecessary re-renders.
- Take a hard look at third-party scripts. Do you really need five tracking tools? Many of them can be loaded later or only on demand.
Cumulative Layout Shift (CLS): Why does my page jump around while loading?
Cumulative Layout Shift (CLS) measures how much a page's layout shifts unexpectedly while it loads. You know the feeling: you go to tap a link, a banner loads at the last second, everything slides down, and you hit the wrong thing. That's exactly what CLS captures.
The value isn't a time but a score. It's calculated from the share of the viewport that moves, multiplied by how far it moves. The target is under 0.1.
What affects CLS?
CLS problems almost always come down to space that wasn't reserved. The browser doesn't know how much room an element needs, so it has to rearrange the layout once the element arrives:
- Images, videos or iframes without set dimensions. Without width and height, the browser reserves no space and shoves everything aside as soon as the element loads.
- Ads and embeds that load dynamically and only claim their space once they appear.
- Dynamically injected content such as cookie banners, notices or alerts that push existing content out of the way.
- Web fonts. When a web font loads and replaces a fallback font with different metrics, the text shifts (FOUT/FOIT).
- Animations that trigger layout by moving elements via properties like
toporheightinstead oftransform.
What this looks like in practice
A product category page loads its product images without width and height. The text renders neatly at first, then the images pop in one by one and push the whole list down in jerks. Anyone trying to tap a product at that moment misses it. CLS: red.
How to fix a poor CLS
- Set fixed dimensions for all media. Give every image, video and iframe an explicit
widthandheight, or use CSSaspect-ratio. That way the browser reserves the space from the start:
<img src="/product.webp" width="800" height="600" alt="Product photo">
- Reserve space for ads and embeds. Give each ad slot a container with a fixed minimum height so nothing jumps when the ad loads.
- Don't insert content above existing content. Show banners and notices as overlays instead of pushing existing elements down.
- Tame your web fonts. Preload fonts, set a sensible
font-displayvalue and usesize-adjustso the fallback font and the web font take up roughly the same space. - Animate with
transforminstead of properties that force a layout recalculation.
The nice thing about CLS: of the three metrics, it's often the quickest to fix. Set fixed dimensions, reserve space, and for many pages that's most of the work done.
Does lazy loading help your Core Web Vitals?
Lazy loading means loading resources only when they're actually needed, usually when the user scrolls them into view. Instead of downloading all 40 images on a long page right away, the browser starts with only what's in the visible area. Browsers have supported this natively for years, no JavaScript required:
<img src="/product.webp" width="800" height="600" loading="lazy" alt="Product photo">
Sounds like a pure win, but it isn't. Depending on how you use it, lazy loading can improve your Core Web Vitals or make them worse. So it's worth taking a closer look.
When does lazy loading help?
- Below the fold. Images, videos and iframes that only become visible after scrolling don't need to load right away. That saves bandwidth and frees up network and CPU time for the initial render.
When lazy loading backfires
And here's the part many people miss: never lazy-load the LCP element or anything above the fold. If you put loading="lazy" on your hero image, of all things, the browser has to wait until it knows the image is visible before fetching it. That artificially delays the very element your LCP is waiting for. It's one of the most common self-inflicted LCP problems.
The rule of thumb:
- Above the fold (what's visible without scrolling): load as normal, and give the LCP image extra priority with preload and
fetchpriority="high". - Below the fold: use
loading="lazy".
There's also a link to CLS: lazy-loaded images need width and height (or aspect-ratio) too. Otherwise the browser reserves no space, and the layout jumps right as the user scrolls to that spot. Lazy loading without fixed dimensions just trades an LCP problem for a CLS problem. Get both right, and it works.
Which supporting metrics should you know?
The three Core Web Vitals are what counts. But when you're debugging, you'll come across other metrics that aren't Core Web Vitals but are still extremely useful, because they show you why a metric is weak:
- Time to First Byte (TTFB): the time until the first byte arrives from the server. An early warning sign for LCP problems. Under 200 ms is good; from around 500 to 600 ms it gets critical.
- First Contentful Paint (FCP): the moment the first piece of content appears (text, an image, anything). A poor FCP almost always drags LCP down with it.
- Total Blocking Time (TBT): the time, measured in the lab, during which the main thread was blocked. TBT is the best lab proxy for INP, since INP itself is hard to measure in the lab without real interactions.
- Speed Index: how quickly the visible area fills up visually.
For context: these metrics show up in Lighthouse and PageSpeed Insights, but they don't feed directly into rankings. They're diagnostic tools, not assessment criteria. Use them as pointers to the cause, not as goals in their own right.
Why does Google separate mobile and desktop?
One detail that often leads to nasty surprises: Google assesses Core Web Vitals separately for mobile and desktop. In practice, mobile is almost always the bottleneck. Phones have weaker processors, slower connections and smaller screens, so heavy JavaScript hits them harder.
What feels lightning fast on your MacBook with a fiber connection can feel sluggish on a three-year-old mid-range Android phone. And those are exactly the users Google wants its data to reflect. So always optimize and test for mobile first. If you only watch your desktop scores, you'll be left wondering why Search Console keeps flagging issues.
How do I measure my Core Web Vitals?
You can only fix what you measure. Luckily, there's a solid set of free tools for that. Ideally, you combine field and lab data:
- Google Search Console, "Core Web Vitals" report. Your starting point. Based on real field data, it shows which URLs or URL groups have problems and gives you the big picture for your whole domain.
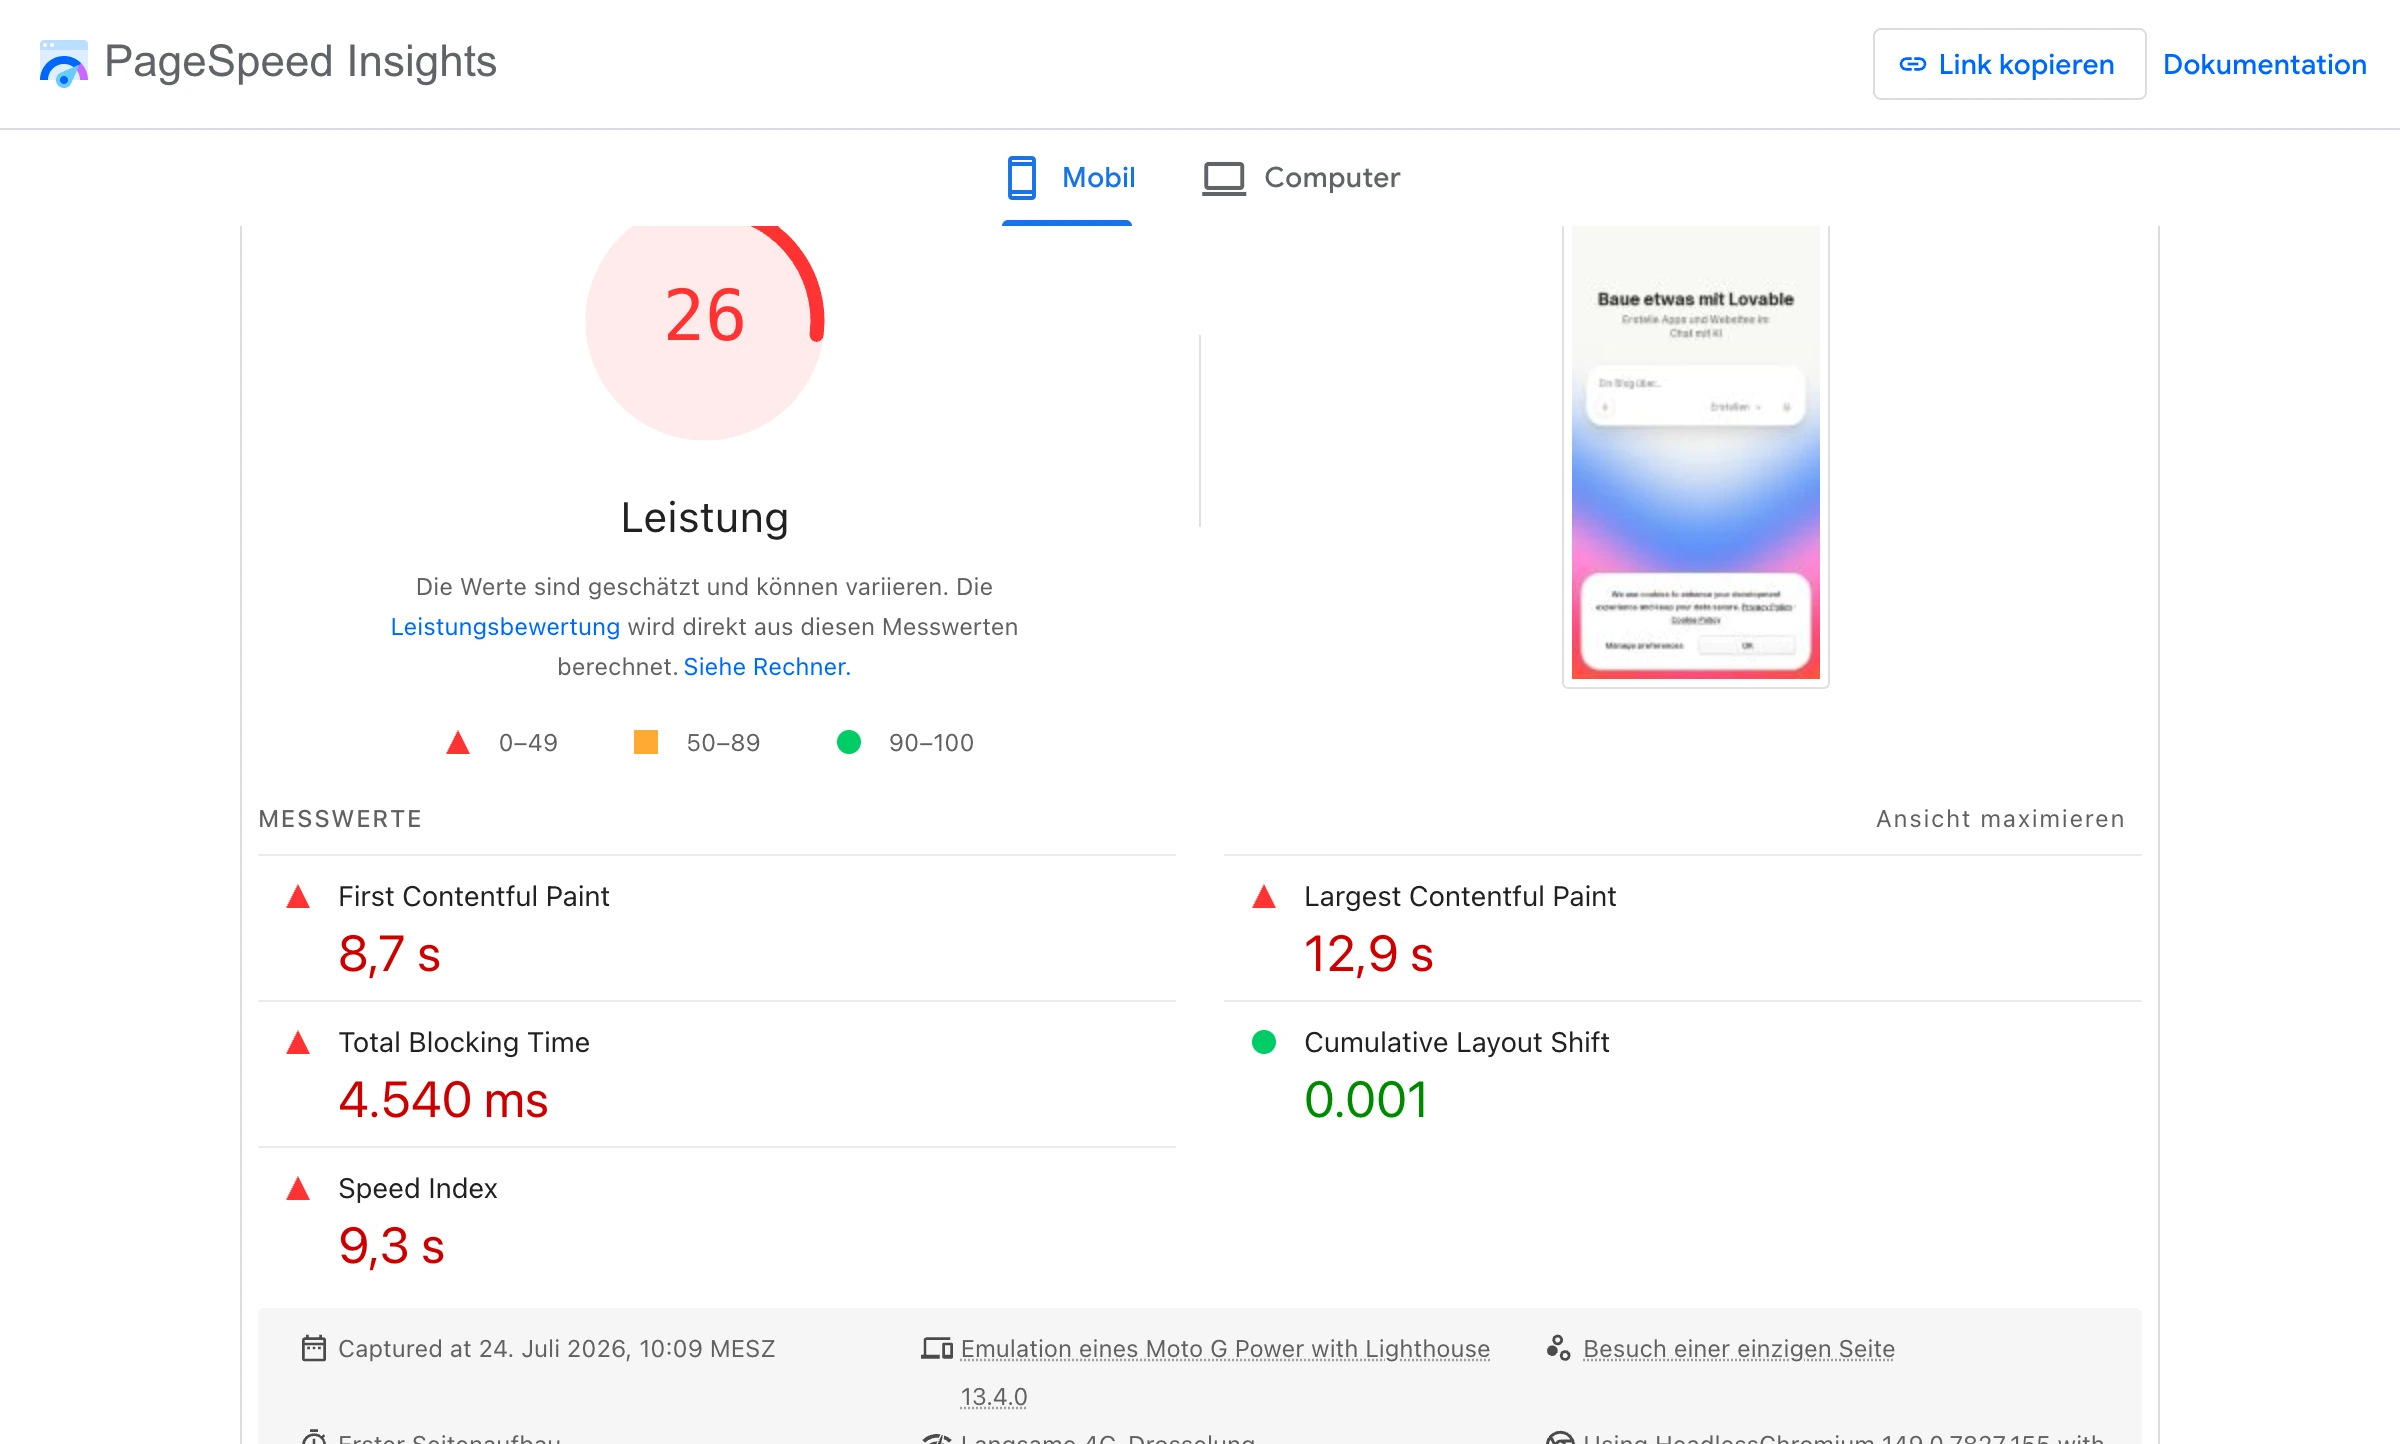
- PageSpeed Insights. Combines field and lab data for individual URLs and gives you concrete suggestions for improvement. Just enter the URL and click "Analyze". Ideal for taking a closer look at a page that stands out.
- Chrome DevTools ("Performance" and "Lighthouse" panels). The developer tools built right into your browser, for local debugging. This is where you'll find render-blocking resources and long JavaScript tasks over 50 milliseconds that hurt your INP. The big advantage over PageSpeed Insights: you can also test local pages and pages behind a login.
A practical workflow: open Search Console, find the pages marked "Poor", run the most important ones through PageSpeed Insights, compare field and lab data, then dig deeper with DevTools. Test again after every change, but give the field data time to catch up.
How can Claude in the terminal pinpoint your weak spots?
PageSpeed Insights does tell you what's wrong ("reduce unused JavaScript", "use modern image formats"). But the findings are often generic and unsorted, and it's up to you to work out which ones actually matter for your site. That's where it helps to have Claude analyze and prioritize them for you.
What is Chrome DevTools MCP?
In September 2025, Google released Chrome DevTools MCP. MCP stands for Model Context Protocol, an open standard that lets AI assistants talk to external tools and data sources. Chrome DevTools MCP is one of these building blocks: it gives an AI coding agent like Claude Code (Claude in the terminal) direct access to a real, running Chrome browser.
With it, Claude can open a page, record a real performance trace, inspect network requests and the console, and, crucially, run the same kind of analysis as Lighthouse and PageSpeed Insights, including an LCP breakdown and real field data.
The advantage over a plain PageSpeed report: Claude explains the analysis in plain English and puts it in context. Instead of "optimize your images", you learn exactly which element is slowing down your LCP, which task is blocking INP and which fix will have the biggest impact. So you don't just get a list of symptoms, but a clear, prioritized plan for where to start.
Two ways to use it
- Paste in your results. Copy the specific findings from PageSpeed Insights into the terminal and have Claude turn them into a prioritized to-do list: What has the biggest impact? What's a quick win? Where's the biggest lever?
- Let Claude measure for itself. Just give Claude the URL. The MCP records its own trace, and Claude reports the real bottlenecks first-hand instead of relying on someone else's report.
How to set it up
You need two things: a recent version of Node.js (22 or newer) and an up-to-date Chrome. Then install the official plugin, which bundles the MCP server with matching skills:
claude plugin marketplace add ChromeDevTools/chrome-devtools-mcp
claude plugin install chrome-devtools-mcp
Or, for a leaner setup, just add the server:
claude mcp add chrome-devtools npx chrome-devtools-mcp@latest
After that, a plain-language prompt is all it takes, for example:
"Use the Chrome MCP. Check the Core Web Vitals of https://my-site.com, break down the LCP and suggest concrete improvements."
Claude then opens the page, records a trace and comes back with well-founded suggestions, such as deferring non-critical JavaScript or optimizing a specific image to bring down the LCP.
You'll find the official guide in the Chrome documentation for agents and on the Anthropic plugin page.
Which metric first? How to prioritize
If all three metrics count at the same time but your time is limited, where do you start?
The answer is almost always: fix the weakest metric first. The one number that keeps you below the passing threshold is the one with the biggest payoff. It's rarely worth pushing an LCP that's already green from 2.3 to 1.9 seconds while your INP is sitting in the red at 400 milliseconds.
The Chrome team has put together an overview of which fixes have the biggest impact for each metric: The most effective ways to improve Core Web Vitals. A good guide if you're not sure where the biggest lever is.
As a rough guide, here's where different page types typically fail:
- Blog posts and homepages most often fail on LCP, usually because of large images.
- Product and category pages often struggle with CLS because of content that loads in dynamically.
- Checkouts, forms and filter-heavy listings usually fail on INP because there's a lot of JavaScript involved.
One last tip from experience: TTFB (Time to First Byte), the time until the first byte arrives from the server, isn't a Core Web Vital itself, but it's a good early warning sign. If it's consistently above 500 to 600 milliseconds, the problem is rarely your front end. It's usually your hosting or caching. TTFB is effectively the floor for your LCP: if the server is slow, LCP can't be fast, no matter how clean everything else is.
What if Google shows no data?
A problem smaller sites run into all the time: PageSpeed Insights or Search Console basically tells you there isn't enough data. The reason is simple. Google only shows field data once a page gets enough visitors for the values to be anonymous and statistically reliable. Many websites never reach that threshold for individual pages.
No reason to panic, though. You just need a different approach:
- Use origin-level data. When data for a specific URL is missing, Google often falls back to aggregated data for the whole domain. That at least gives you a rough direction.
- Rely on lab data. Without field data, Lighthouse and Chrome DevTools become your main source. They only measure a simulated snapshot, but they reliably reveal specific weak spots.
In short: no data doesn't mean no problem. It just means you have to measure things yourself instead of relying on Google's ready-made report.
Why it's worth the effort
It's tempting to write all this off as technical busywork. But it's more than that. Better Core Web Vitals pay off twice: in visibility, and in the business numbers behind it.
A widely quoted rule of thumb from performance research says that just one extra second of load time can cut conversions by around 7 percent. You don't have to take that number literally to see the trend: slow, jumpy, laggy pages cost you users, before they even get to your content.
Fast, stable pages keep people around longer, reduce bounces and improve exactly the kind of user behavior Google pays attention to anyway.
There's also a newer angle: AI search tools like Google AI Overviews, ChatGPT Search and Perplexity are becoming increasingly important sources of answers. Speed does play a role here, but mainly as a gatekeeper: AI crawlers fetch pages in real time with tight timeouts, so a fast server response improves your chances of being fetched and cited in the first place (overview at Otterly.AI).
But speed alone won't earn you citations. The largest analysis to date, covering more than 107,000 pages in Google AI Overviews, found only a weak link between Core Web Vitals and AI visibility. What ultimately gets cited is clear, well-structured, up-to-date content. So performance isn't a shortcut into AI answers either. It's the baseline that gets your content into the running at all.
Official sources and tools
If you want to dig deeper, here are the key resources, straight from Google:
- PageSpeed Insights: the free tool for testing individual URLs (field and lab data in one place)
- Chrome DevTools: the browser's built-in developer tools for local debugging
- Lighthouse: the audit tool behind the lab data
- Google Search Central: Core Web Vitals: Google's official documentation on Core Web Vitals and rankings
- web.dev: Web Vitals: the Chrome team's technical reference for all metrics
- web.dev: How the thresholds were defined: the background on the thresholds and why Google chose the 75th percentile
- web.dev: The most effective ways to improve Core Web Vitals: the Chrome team's prioritized best practices for each metric
- Chrome DevTools MCP: for running performance analyses directly with an AI agent like Claude Code
In the end, it's all refreshingly unspectacular. Core Web Vitals aren't some impenetrable Google mystery, just three questions with clear answers. Does the content show up fast (LCP)? Does the page respond quickly (INP)? Does the layout stay put (CLS)? For each one, you now know the typical causes and the right fixes.
My advice: don't start with the toolbox, start with a measurement. Open Search Console, find your weakest metric and work forward from there, one fix at a time. It's a lot less daunting than it probably feels right now.